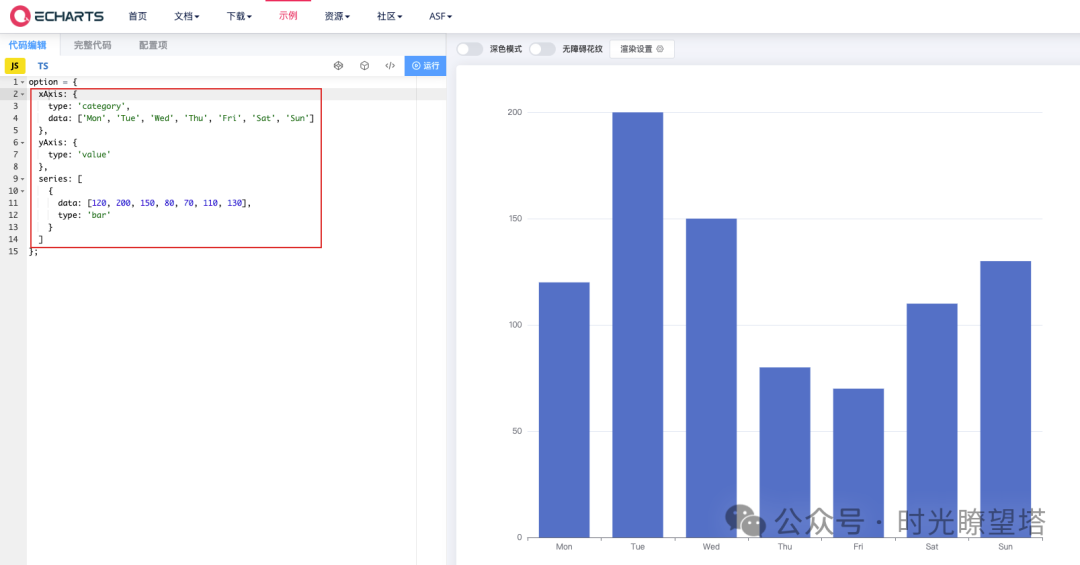
import csvimport jsondef main(csv_string): # 将CSV字符串分割成行 lines = csv_string.strip().split('n') # 使用csv模块读取数据 reader = csv.reader(lines) # 将所有行转换为列表 data = [row for row in reader] # 将数字字符串转换为浮点数 for row in data[1:]: # 跳过标题行 for i in range(1, len(row)): try: row[i] = float(row[i]) except ValueError: pass # 创建完整的ECharts配置 echarts_config = { "legend": {}, "tooltip": {}, "dataset": { "source": data }, "xAxis": [ {"type": "category", "gridIndex": 0}, {"type": "category", "gridIndex": 1} ], "yAxis": [ {"gridIndex": 0}, {"gridIndex": 1} ], "grid": [ {"bottom": "55%"}, {"top": "55%"} ], "series": [ # 第一个网格中的柱状图系列 {"type": "bar", "seriesLayoutBy": "row"}, {"type": "bar", "seriesLayoutBy": "row"}, {"type": "bar", "seriesLayoutBy": "row"}, {"type": "bar", "seriesLayoutBy": "row"}, # 第二个网格中的折线图系列 {"type": "line", "xAxisIndex": 1, "yAxisIndex": 1}, {"type": "line", "xAxisIndex": 1, "yAxisIndex": 1}, {"type": "line", "xAxisIndex": 1, "yAxisIndex": 1}, {"type": "line", "xAxisIndex": 1, "yAxisIndex": 1}, {"type": "line", "xAxisIndex": 1, "yAxisIndex": 1}, {"type": "line", "xAxisIndex": 1, "yAxisIndex": 1} ] } # 生成输出文件 output = "```echartsn" + json.dumps(echarts_config, indent=2, ensure_ascii=False) + "n```" return {"output":output}